Application example: Online data visualization
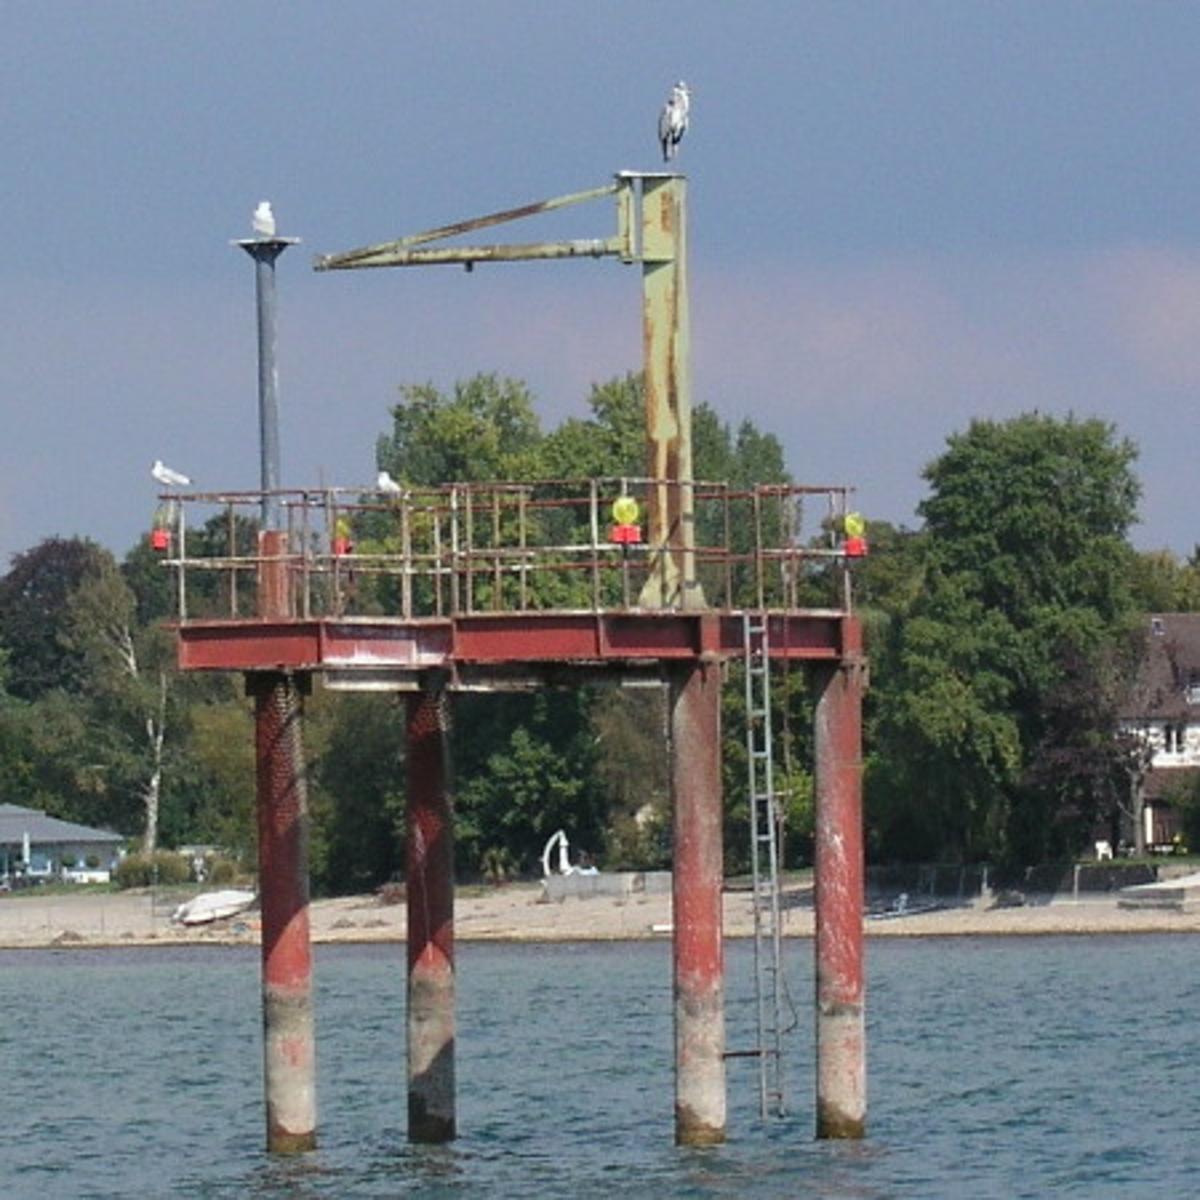
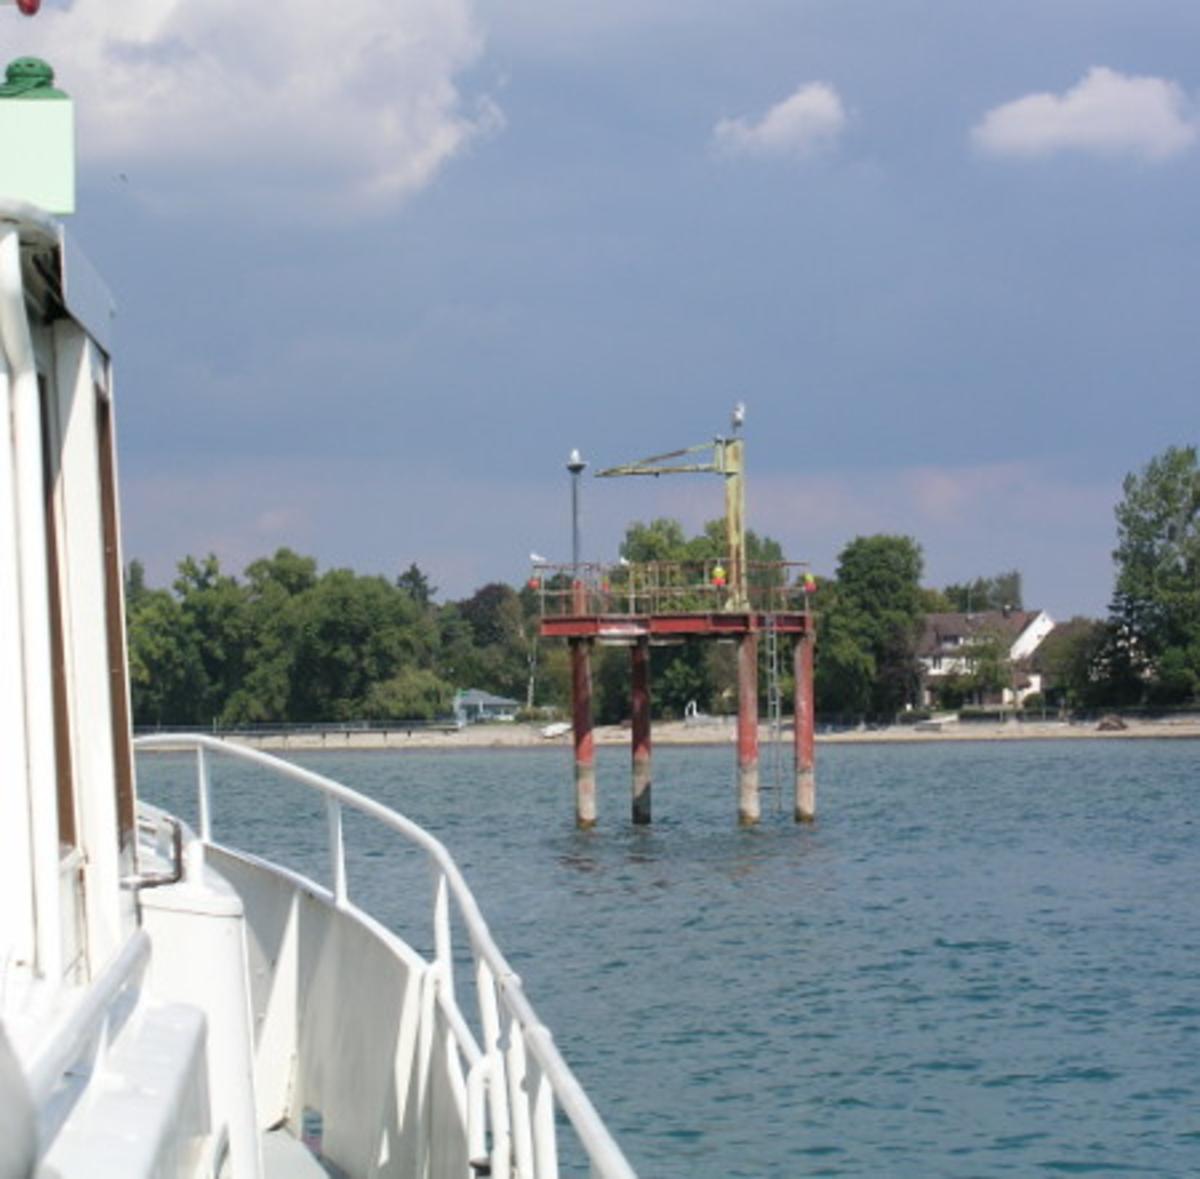
Online visualisation of data collected from the Institute for Lake Research (ISF) measuring station
Get product information here:
Custom designed visualisation of the online data in a web browser to inform the general public and holiday guests of current conditions.
Part of the institute’s public relations is to share the findings of the institute's work to the interested public and increase acceptance of the institute’s activities.
Relevant parameters are presented in the public-facing online visualisation. At the station, a total of 20 parameters on water level, quality and weather are recorded
- Individual programming on customer request
- Flexible design options
- Variable number of parameters
- Various design options